For my conference project, I’m doing an infographic on the evolution of journalism. It’s not really a space-altering project, but because I’m going into journalism after I graduate this semester, I’m using this as a way to learn digital media skills and to use images to help tell a story.
Right now I’m working on my data sheet, which will contain my subheads (i.e. no. of newspapers that have shut down/become online only, percentages of how people get their news now) and the info/stats that I’ll be using.
Then, I’ll move on to design and layout. I’ve been collecting infographics I’ve found online that I like, and am using them to figure out what kind of fonts/colors etc will be most useful, and how to represent information in graphic form.
My general idea for the layout is to have the infographic be an ipad screen, to showcase how most people get their news digitally nowadays. The interior will be in the style of either a digital news story or a news app, with different sections containing text, stats, pictures and a timeline.
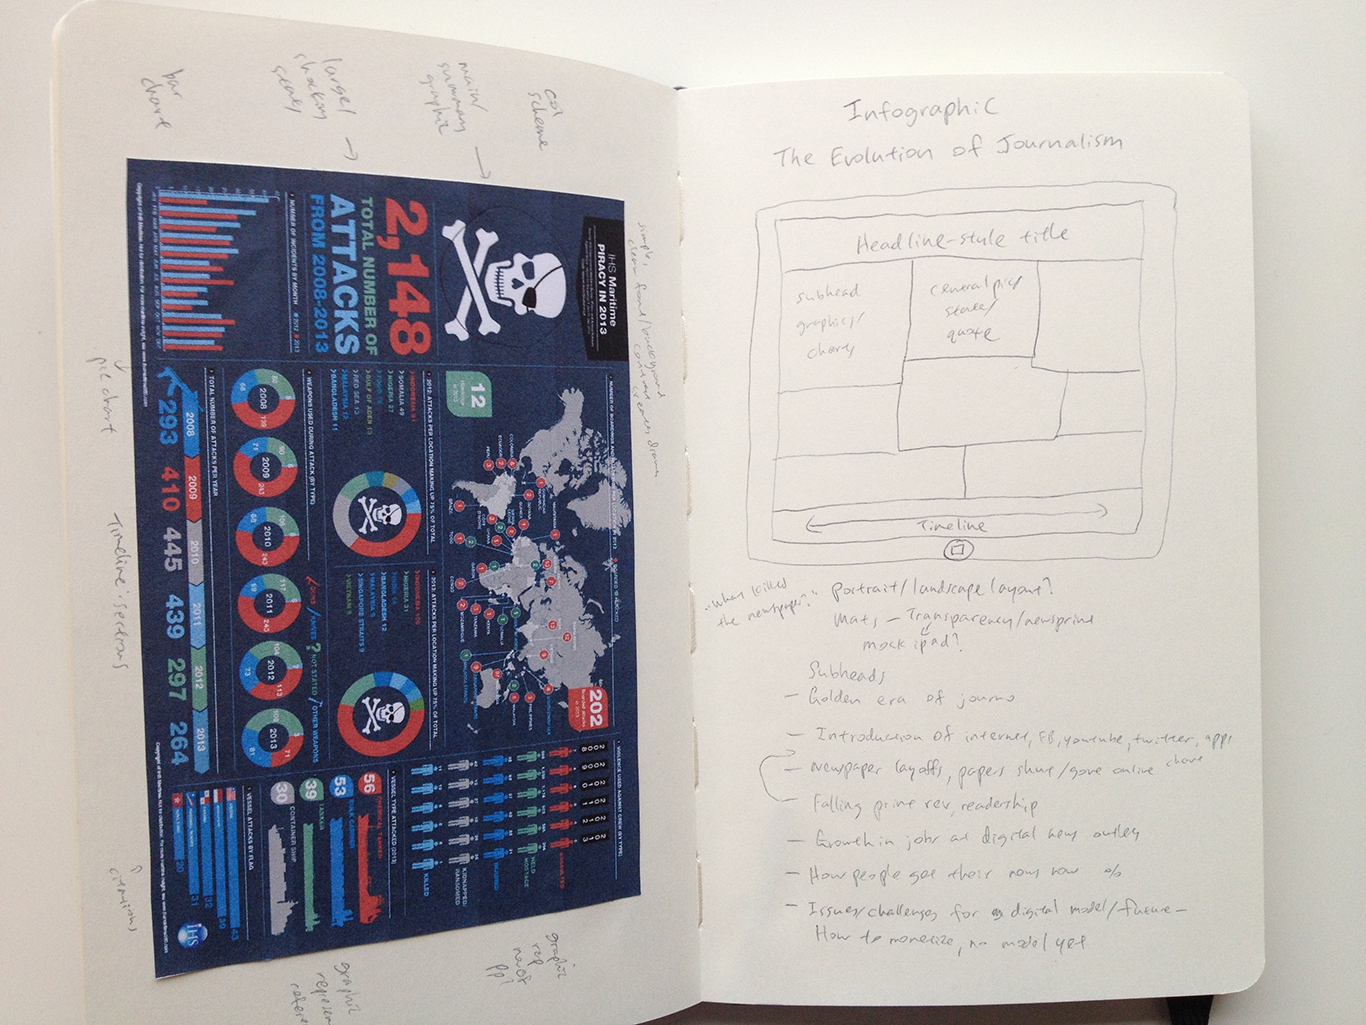
Material-wise, I’m thinking of either transparency, to follow the ipad theme and make it look like a screen cover, or newsprint, for the irony.
The Saskia Sassen reading talks about how technology is enabling alternate networks and independent media to subvert media conglomerates by creating globalities that maintain their localities, and I think my infographic will demonstrate that in part.


