**having trouble uploading more attachments right now, please hold…**
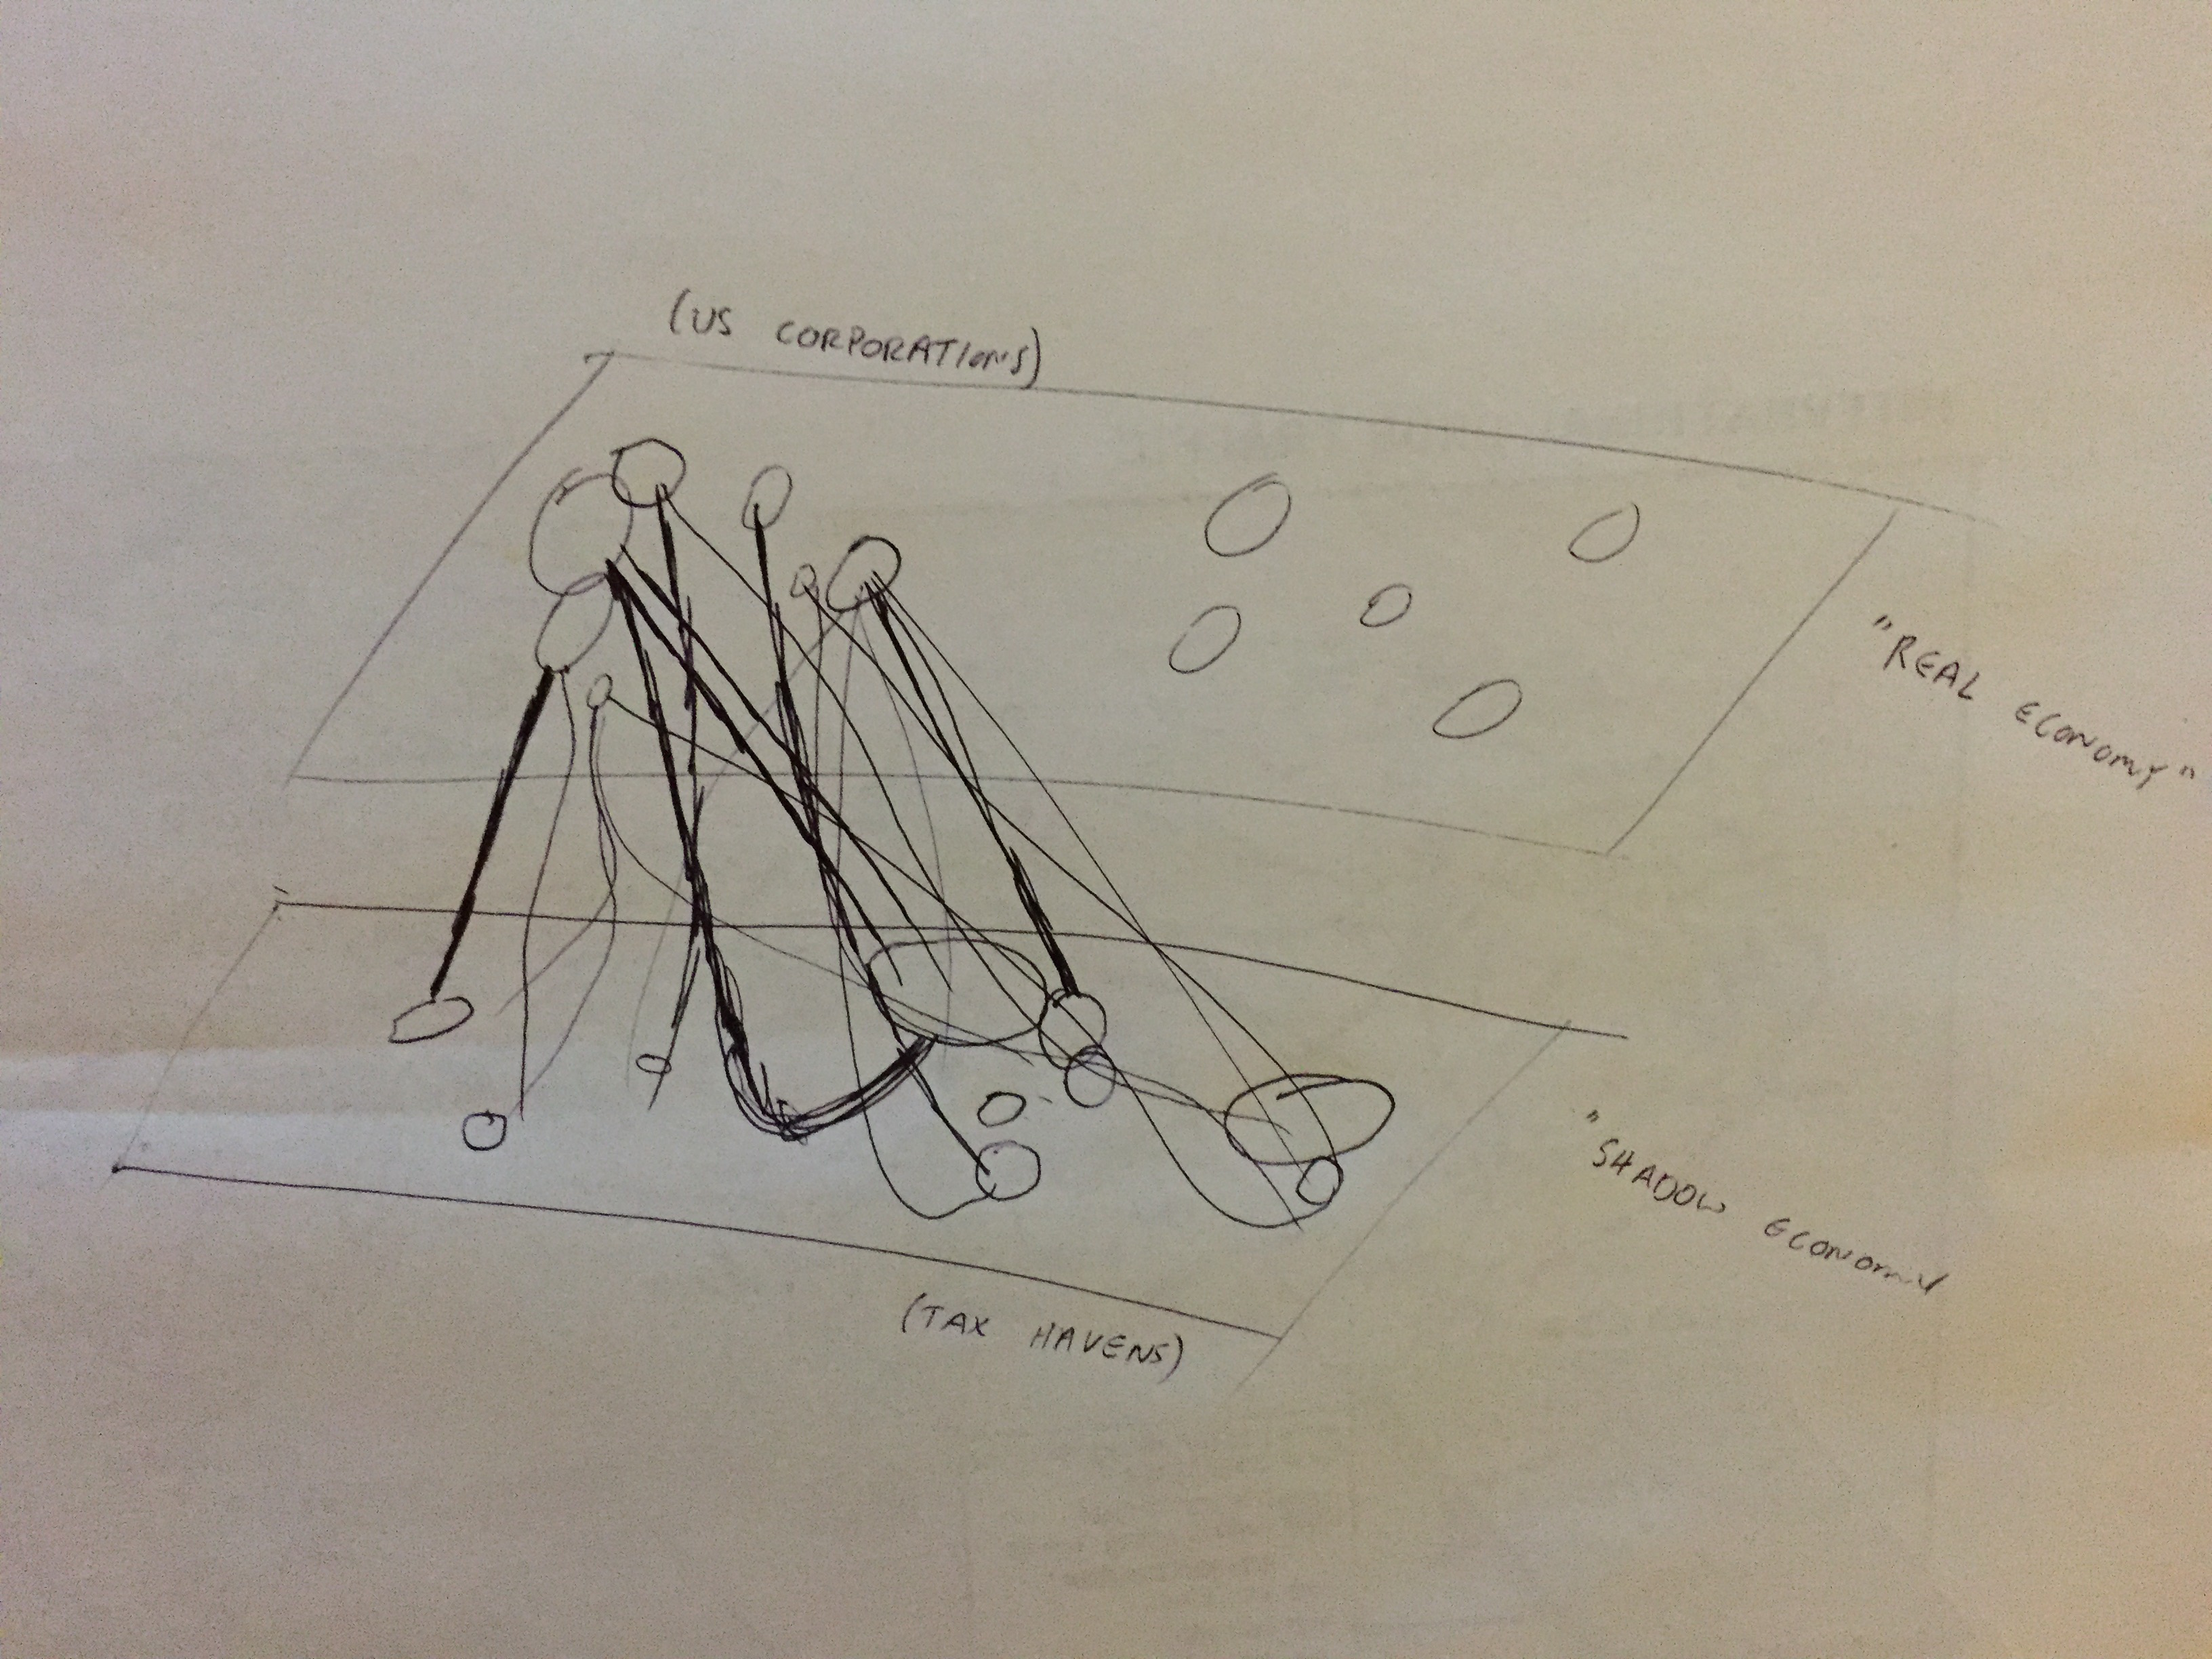
On the “draw anything” part of the interview worksheet for this class, I remember drawing a very offhanded illustration of how I saw the process of money laundering. It’s pretty weird, I know, but for the past year or so the bulk of my research has been on corruption and tax evasion, and these phenomena just happen to be on my mind for an inordinate amount of time. In retrospect, I suppose this is why I ended up taking this class in the first place. I think corruption is the perfect ‘invisible’ to map because it’s so prelavent and impacts us all;. visualizing spatial connections between these things reveals patterns we wouldn’t have easily identified otherwise. On that first sketch, I visualized money laundering as a skein of flows dipping under the surface and popping back out elsewhere, in a different form.
For conference, I wanted to map flows of tax evasion and highlight its cyclical nature in a globalized world. Now, there are a bunch of different forms/methods of tax avoidance that one could map, but for simplicity I chose to map offshore balances of the top 10 or so Fortune 500 companies in various ‘tax haven’ subsidiaries around the world (Data comes from here http://ctj.org/pdf/offshoreshell2014.pdf). The flip side of these are tax havens, which are chosen by corporations typically by the corporate tax rate or the level of secrecy allowed by national banking regulations (see index at http://www.financialsecrecyindex.com/).
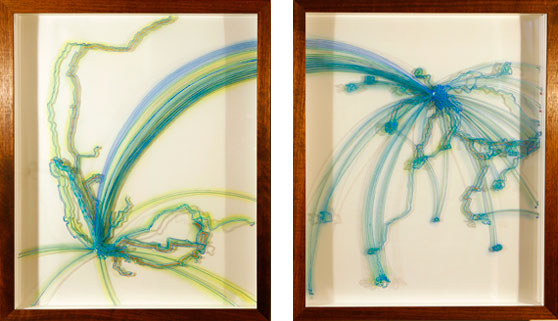
Despite the above, I wanted to keep my map very minimal and free of many technical components. I really did not want this to turn out as a chart or infographic, as tax evasion is most typically visualized. To create something like that you need to be clear and structured, eliminating complexity & chaos. I wanted to do the opposite, focusing on the chaos and the abstraction it forces upon us.
My sign system is pretty straight forward: blue dots are American corporations scaled to the size of their offshore holdings, red dots are tax havens scaled to their financial secrency indices. Squigglier lines signifiy “dirtier” money which transform into straighter lines once they come back up “clean”. My connection system is the flow of cash from American companies into their tax haven subsidiaries. These companies use dozens, sometimes over 100 different offshore accounts, so as one traces the connection system from source to destination the flow splits up according to all of the different locations profits are shifted towards.
I also kind of have two surfaces. I may have abstracted the idea too much for there to be a clear. The first one is the “real” economy, what we see & know to exist, i.e. the Fortune 500 companies who we know are making a lot of profit, indicated by the blue dots of the sign system. The second is the “shadow” economy, where money pours into foreign subsidiaries and comes back up, largely tax-free. The two are overlayed over each other at a perspective, and in between the connection system depicts flows between the two, bridging them together. Reading up on the methodologies of the maps made by the guys at the Spatial Information Design Lab gave me a clearer idea of how to work w/ the data I had.
I got a lot of inspiration from Nina 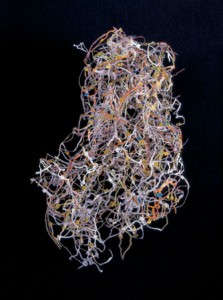 piece “Austria”. The way she assembled strips of a road map really appealed to me because the flattened map was suddenly given a sense of flow and chaos which IMO is a better depiction of human flows. Same thing for the absence of space she creates.
 piece “Austria”. The way she assembled strips of a road map really appealed to me because the flattened map was suddenly given a sense of flow and chaos which IMO is a better depiction of human flows. Same thing for the absence of space she creates.
<p>Also aesthetically I liked the line use Karin Schaefer’s “Kau 3 Decades”