As a scenic designer and student of architecture, I work with many art forms that concern themselves with accurate and realistic depictions of space, but I did not think that the word “cartographer” could apply to me until I discovered the work of Denis Wood.
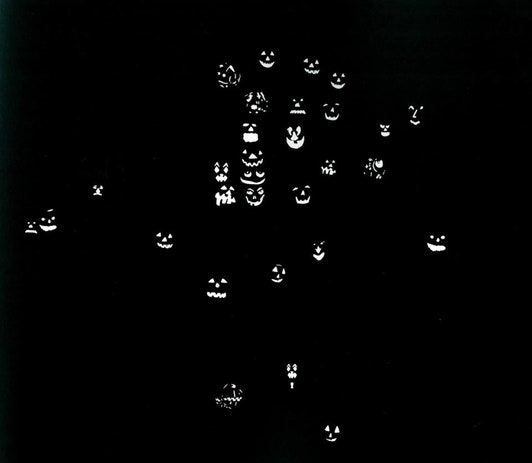
Denis Wood, an artist and college professor of environmental psychology and landscape architecture, has carved out a name for himself among cartographers by doing the exact opposite of what conventional mapmaking dictates—i.e. creating maps not with accuracy or precision in mind, but with sensory input and emotion. His book, Everything Sings, collects his maps of the neighborhood of Boylan Heights, Virginia (which, instead of depicting maps with streets or buildings, displays items such as disfigured trees, police calls, mailman routes, and jack-o’-lanterns) into a single volume that he dubs a “narrative atlas.”
Previously, I had thought that cartography was an art form in skill alone—an exercise in detail and precision that I could not even attempt without serious study of technique and heavy research on the physical aspects of the place I wanted to map. I thought that there could only be two kinds of maps, “right” and “wrong,” and that as soon as a map lacked necessary information, it became a “wrong map.”
But Wood taught me that this is not the case. Although his maps of Boylan Heights provide objective information, they are intentionally incomplete by most mapmaking standards, but that does not lower their informational or even cartographical value. As Ira Glass describes during the introduction he wrote for Everything Sings, “[Denis Wood’s maps]…take a form that’s not intended for feeling or mystery and make it breathe with human life…[The lives of the occupants of Boylan Heights] seem far away and utterly present…which somehow makes our world seem fragile and very precious…that seems like the opposite of the feeling ordinary maps give us.”
For my conference work, I decided to tap into Denis Wood’s cartographical approach to create maps that documented subjective, non-concrete criteria. My earliest notes indicate that I kept a running list of potentially mappable items that I deemed most defined by individual experience: sound, color, poetry, and various emotions like laughter, fear, sadness, or love.
The first phase of my project was an emotion-mapping exercise tailored to certain SLC buildings, similar in scope to Wood’s Boylan Heights project. I was to attend certain events or spend a few hours in one space to mark the rising and falling of emotions within it. I quickly noted that such a project, though valuable and still in the running for a second tier of my current work, was too ambitious and required large amounts of time at a single stretch that I did not have. The final version of this project (which never got off the ground due to an unexpected event that took me off campus for the remainder of the year) had me surveying a large number of Sarah Lawrence students about their favorite places on campus and mapping the subsequent data.
Monday, Apr. 13, 2020 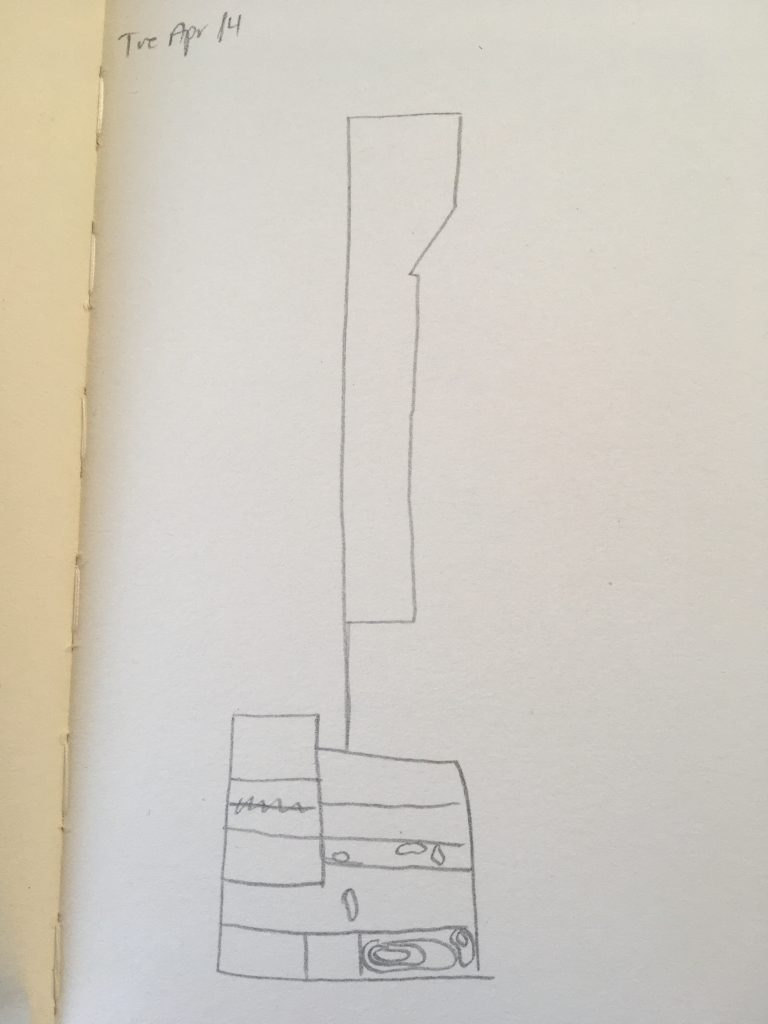
Tuesday, Apr. 14, 2020 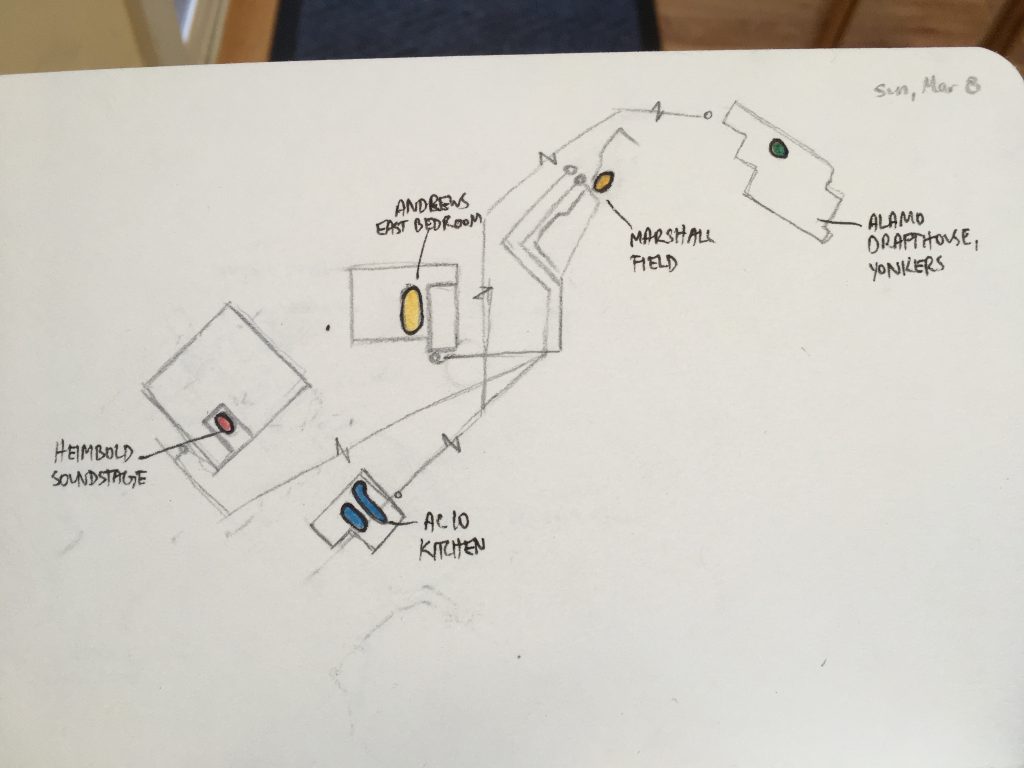
Sunday, Mar. 8, 2020 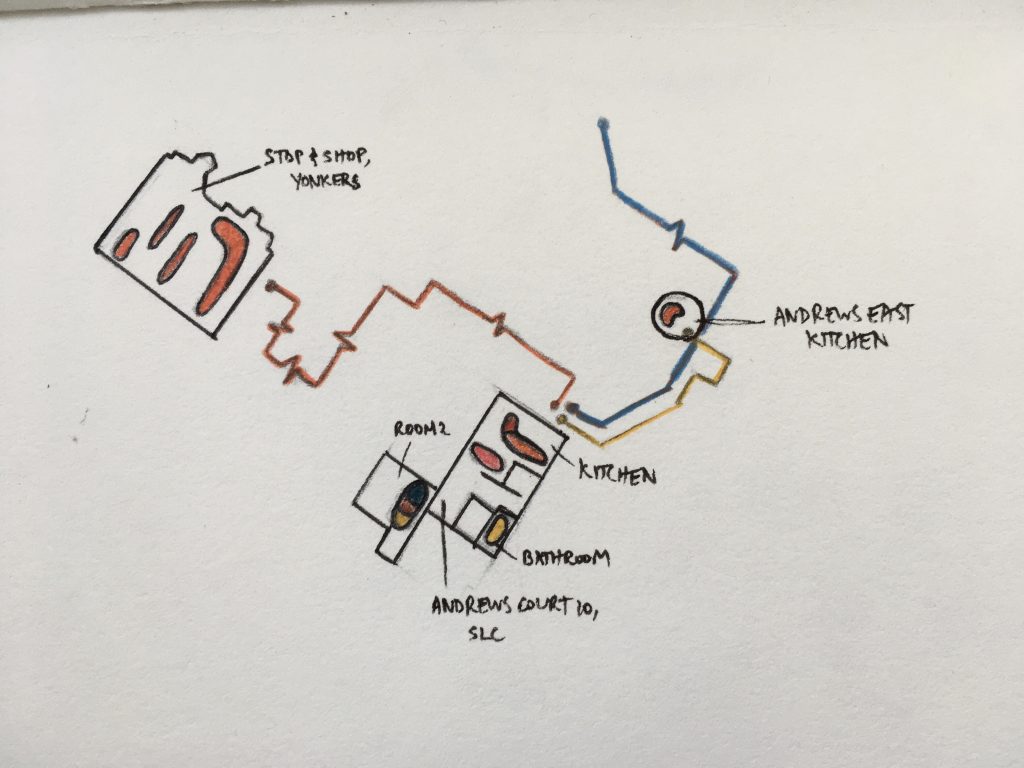
Saturday, Mar. 7, 2020 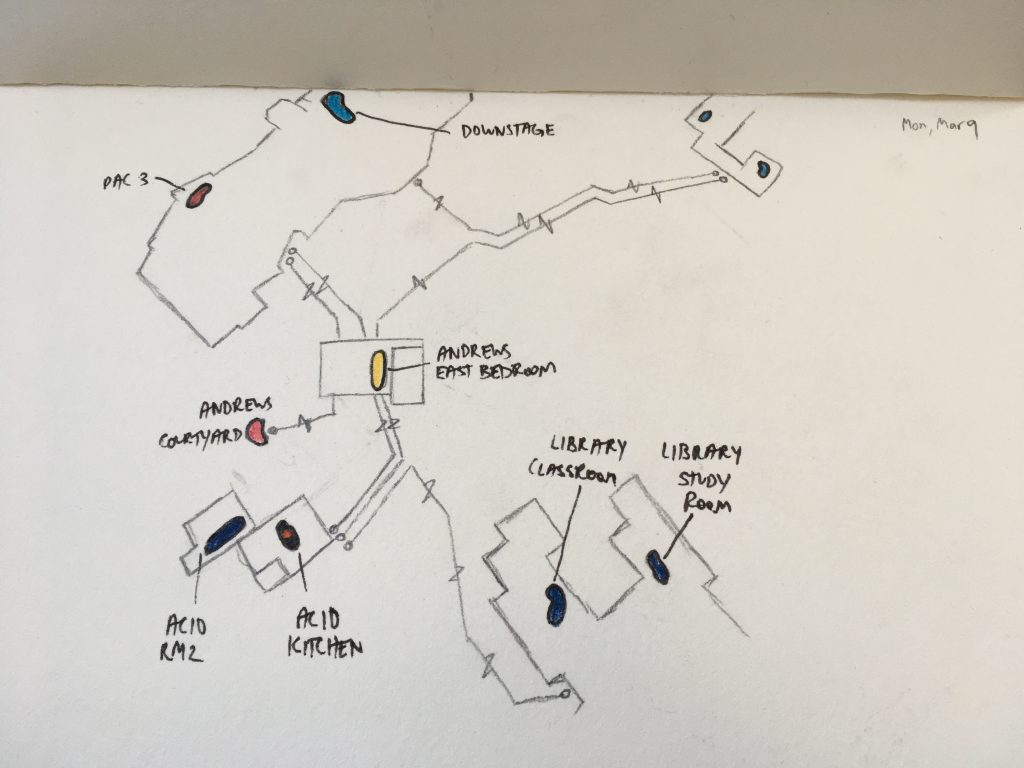
Monday, Mar. 9, 2020
The idea that ultimately turned into Phase Three (i.e. post-coronavirus lockdown) came from the necessity to take the project to a more personal place. I wondered if I couldn’t use this project to discover more about the fluctuation of my own emotions in certain places at certain times, or——instead of laying bare the inner workings of a town, as Denis Wood did with Boylan Heights——to lay bare the inner workings of the artist themself.
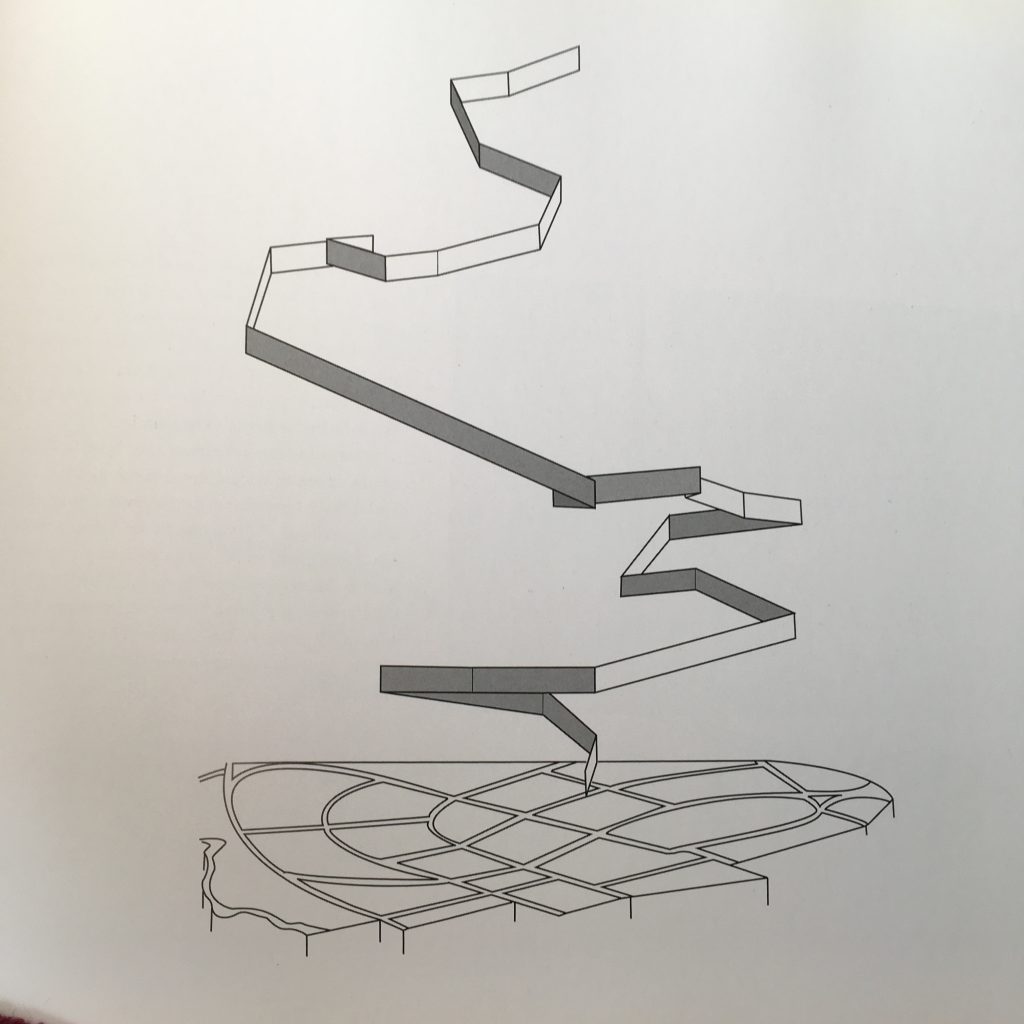
Therefore, the final form of my conference project might best be described as an imprecise visual diary. Much like Denis Wood aimed to create an atlas of comprehensive identity with his maps, I sought to understand myself by mapping every place I go during the day, and what emotions I feel when I go there (noting the differences before and after social distancing).
Monday, Apr. 13, 2020 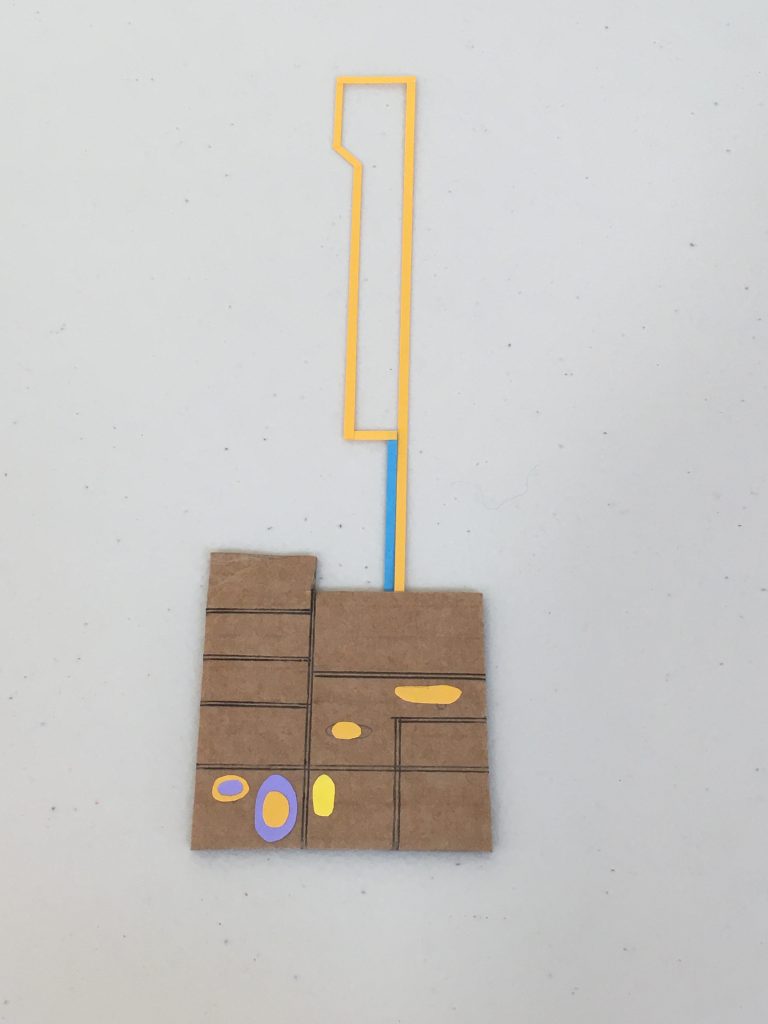
Tuesday, Apr. 14, 2020 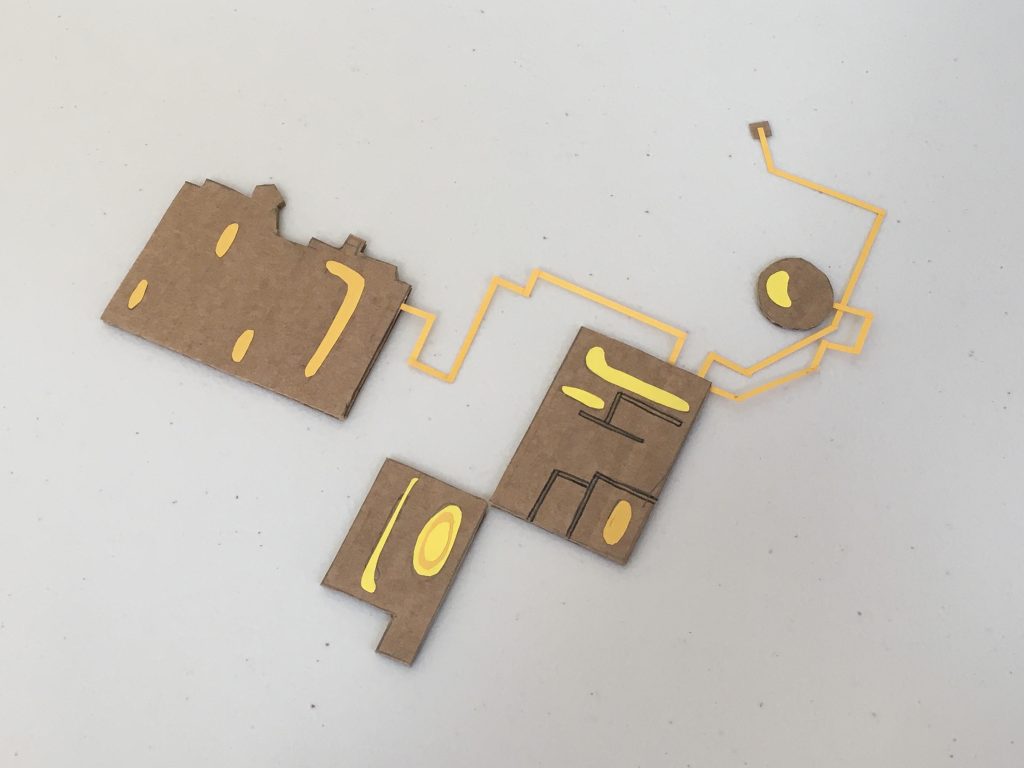
Saturday, Mar. 7, 2020 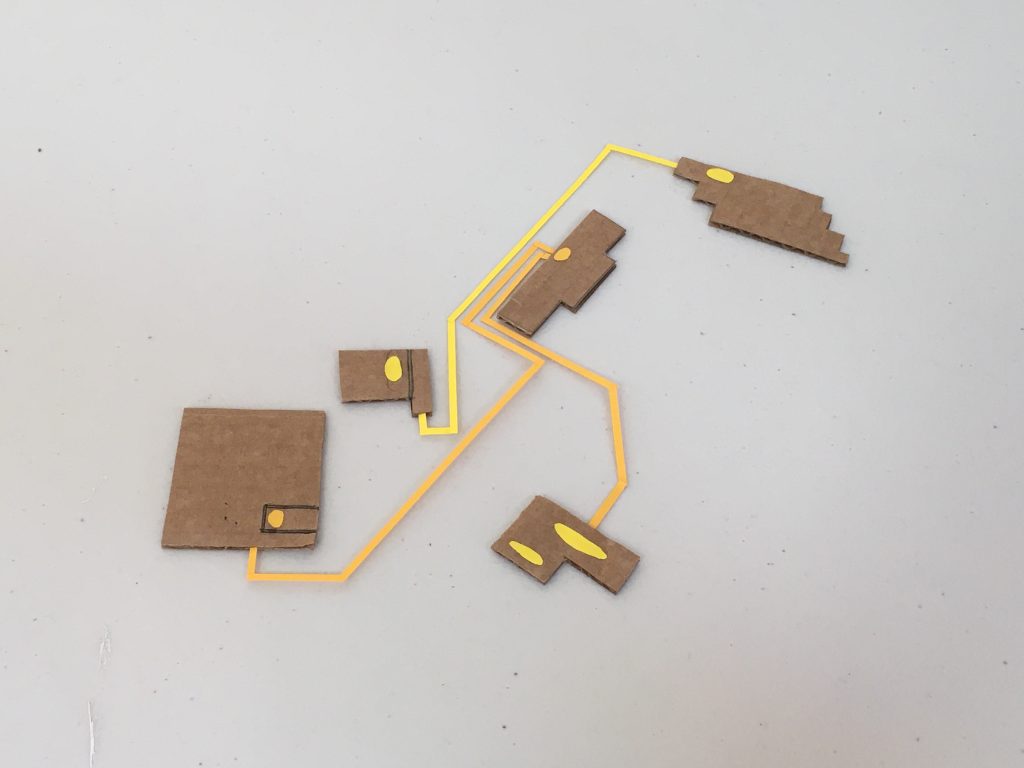
Monday, Mar. 8, 2020 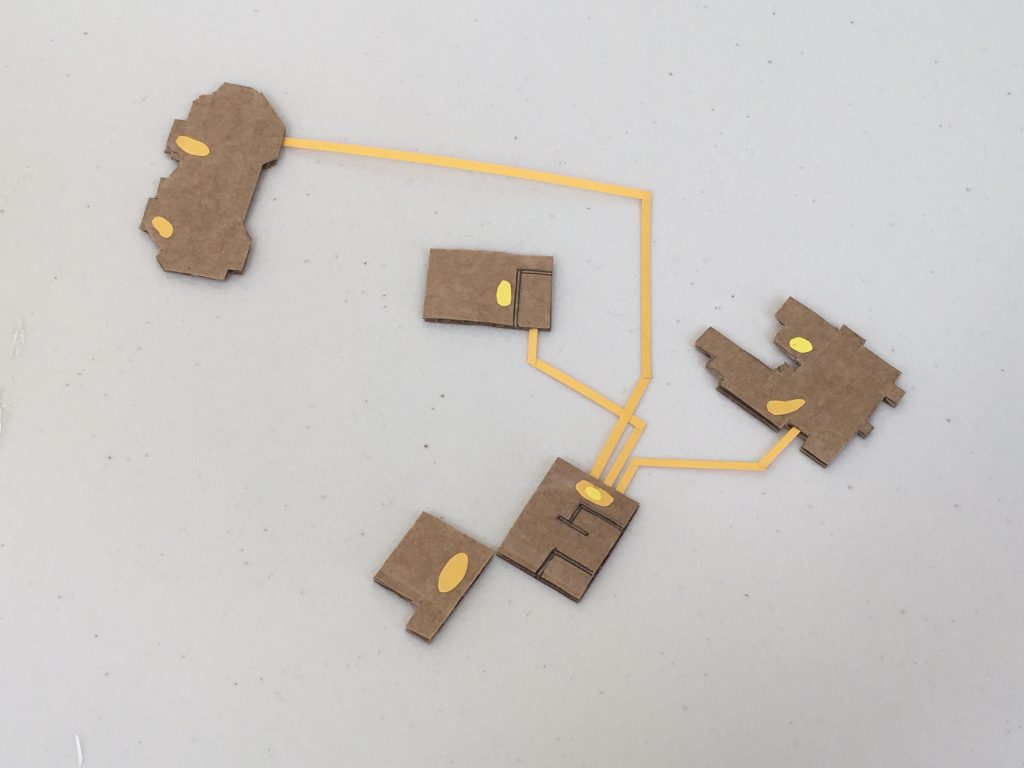
Tuesday, Mar. 9, 2020 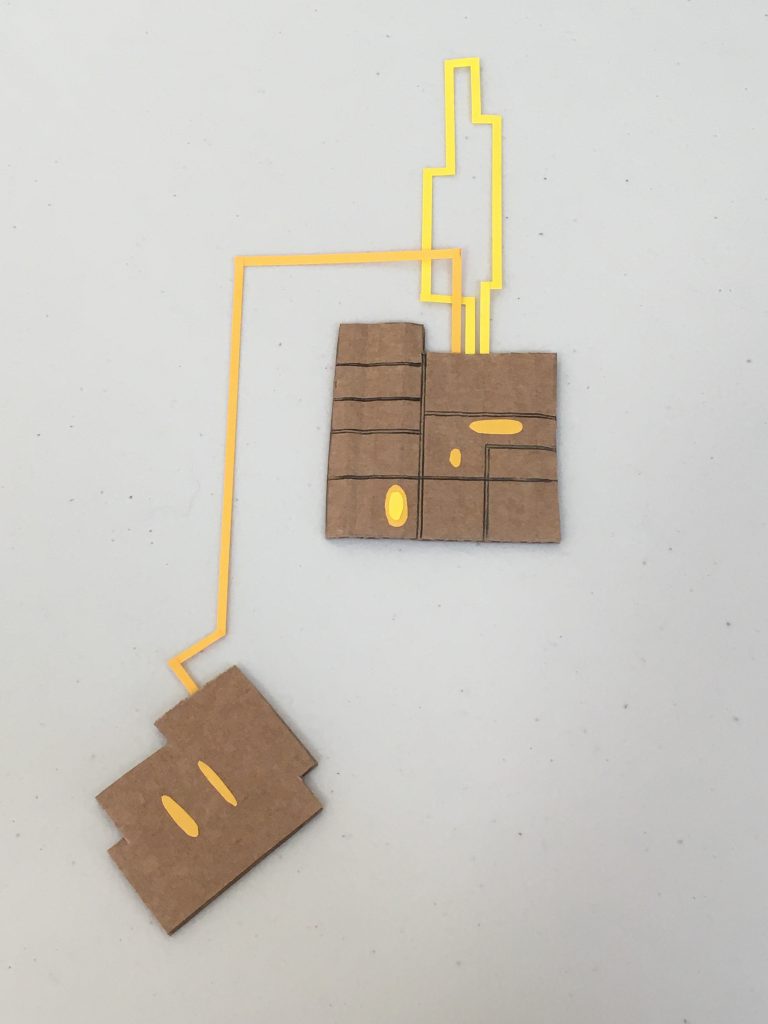
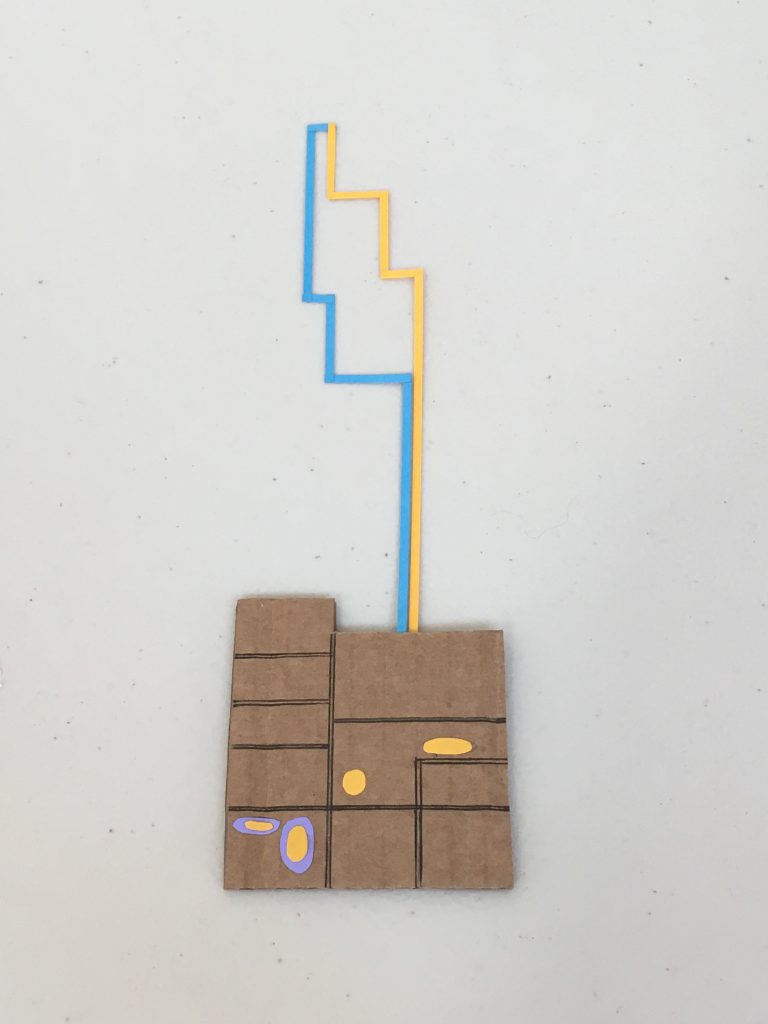
Saturday, May 2, 2020
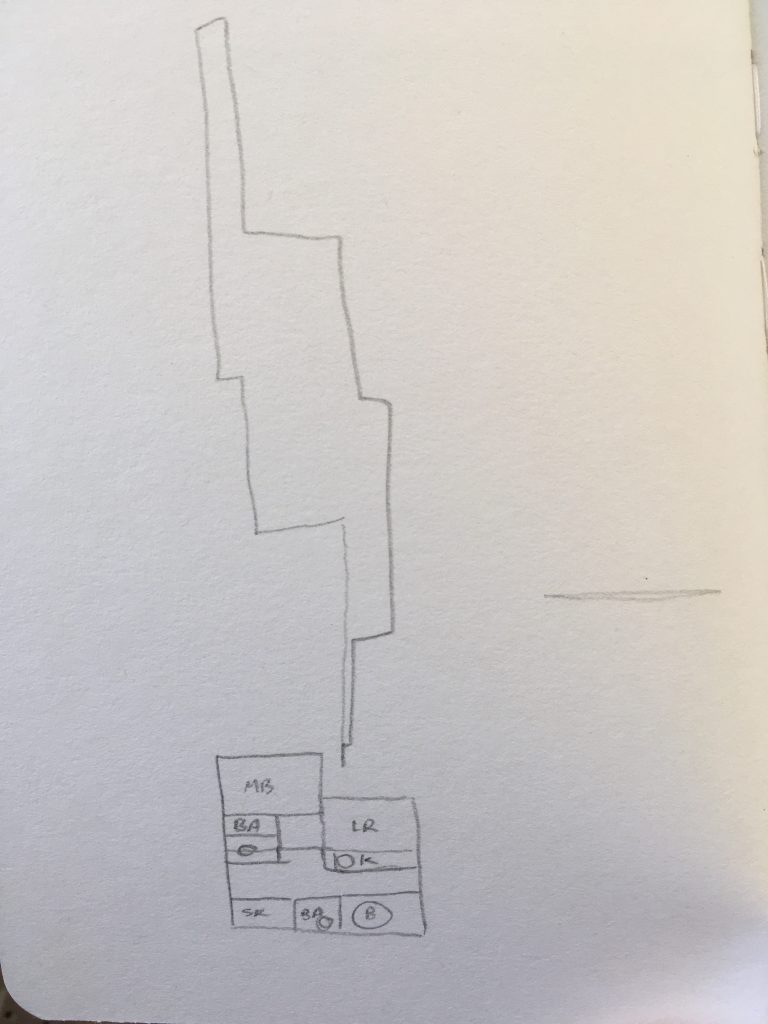
My maps display information such as the intensity of the emotion, its frequency, and where I felt it (though not the exact titles of buildings). They do not tell viewers the reason for the emotion, nor do they demonstrate accurate scale (I did research shapes of buildings and travel routes on Google Maps, but only to get their general shapes, not for precision).
At first, I only sought to map joy, and did (which is why my first three maps are done in only two colors). But after Sarah Lawrence closed due to the spread of COVID-19 and I returned to my childhood home to follow social-distancing protocol, Angela and I both decided that tracking my negative emotions (though more difficult) was equally important. My first sketches also had a different color-coded scale: there were ten separate colors, each representing a span of two hours. Angela pointed out that the use of time as a fluctuating variable was more confusing and less interesting than emotion, so I transferred the color scale to the variable of emotion instead.
I was pleased with this project’s ability to remain a somewhat impartial depiction of my life despite its potential for intense intimacy, and its balance between specificity and creative liberty. Ultimately, “I Am Here” hopes to be two things: an exercise in self-care and a celebration of the mundane.


