

I began thinking about my conference project inspired by a couple of different psychogeographic and map inspired projects. I found the idea of ‘mental travel’ that Merlin Coverley wrote about in Psychogeography incredibly compelling, and I identified it with a lot of my own experiences of daydreaming about distant (or nearby) places. Additionally, over spring break I found the book Atlas of Remote Islands by Judith Schalansky in a book store over spring break. The subtitle of this book is “Fifty Islands I have not visited and never will,” and in the introduction Shalansky writes about her experience of mental travel through looking at atlases as a child growing up in East Berlin, a place she could not travel beyond.

 Shalansky renders a map of the island in question and on the proceeding page, she describes the island’s history and facts about its location and habitability.
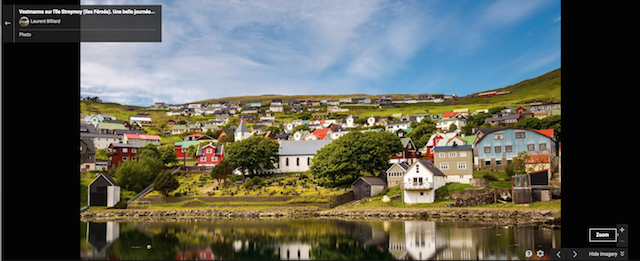
The night before I found the book, I was aimlessly looking through Google Maps when I located a series of islands I had never heard of before called the Faroe Islands. I was surprised to know that 50,000 people lived there, and I clicked through the photographs of the towns there and tried to imagining what life would be like if I had grown up there. This is where the full idea for my conference project came from.
When school started up again, I began to explore different parts of America on Google Map street view. I was drawn to the most rural places, because I grew up in a city and have minimal exposure to living in rural America. Also, often when traveling (at least in my family), we tend to visit cities, both familiar cities where family lives like Los Angeles and Denver, as well as cities we have not seen before. In my writing class, we were talking once about the experience of driving through rural, almost empty areas of the country and trying to imagine what kind of person lives in the houses you pass by. As I looked through Google Maps and chose specific locations to zoom in on, I kept this framework of trying to imagine the lives that inhabit these locations in mind. I selected which specific roads/towns to zoom in on based on whether the street or town names appealed to me.
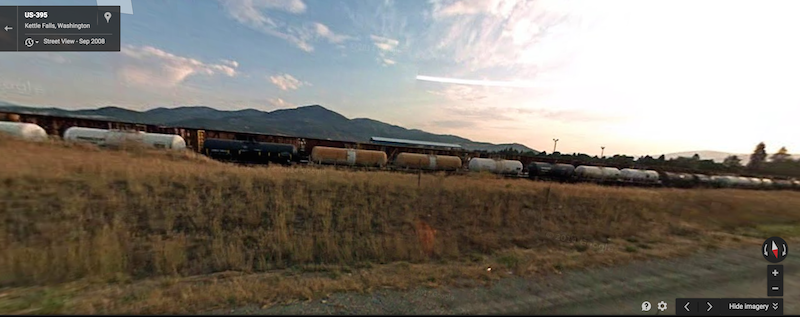
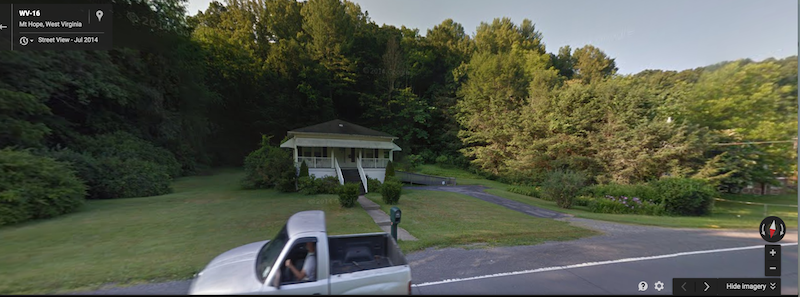
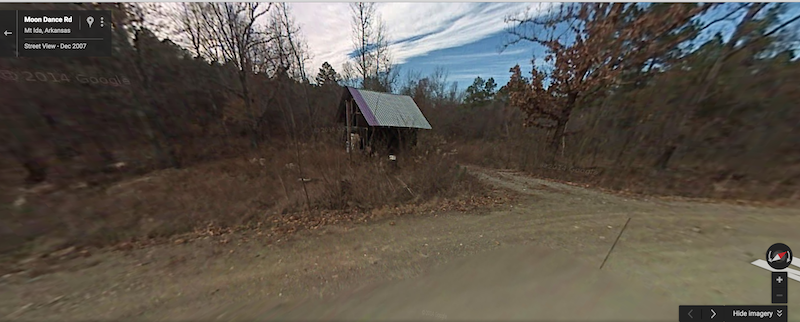
My map will depict aspects of American life that do not appear on maps but that mark the memories and locations of experiences in peoples’ memories. For example, a field where a child found a four leaf clover, or a road where a car accident occurred, or a place where a teenager smokes their first cigarette…these types of milestones do not show up on the terrain or maps of America, but they are very much a part of growing up in the specific spaces. The inspiration for the “invisible” aspect of my map comes from anthropologist Kathleen Stewart’s Ordinary Affects, an ethnography of American life that she depicts through non-fictional vignettes of the ‘ordinary’. I hope to map ordinary affects in my conference project. I am still decided how exactly to present this concept. I began with collage of rectangular pictures shown in the second image of this post and intended to make a 40 by 40″ map in that style. On top of the ‘surface’ (the screenshots of different street views), I would write in sharpie the ordinary event that occurred there which would be the sign system.

I’m not sure what the connection system would be in this map. When I brought my digital sketch to conference, Una and I discussed ways that I could use the map to combat competing discourses that define American life. We thought of using a chart of the stock market crash as a “surface” containing holes which reveal the screenshot images I took and the sign system details that explain the ordinary events that occurred in the spaces.

The issue now is that the draft I have is rectangular and therefore not 40 by 40, and I can’t use as many images as I hoped to. I also want to make sure it is read as a map.


